A web page’s emissions come from three layers: servers and data centres, networks, and the user’s device. Large third-party scripts and bot traffic add avoidable overhead.
Use trusted tools such as Website Carbon and Digital Beacon to estimate grams CO₂ per page view and find the heaviest assets.
Global evidence shows data centres consume roughly 1–1.5% of electricity today; demand is rising fast with AI. Cutting page weight and using cleaner hosting have real climate value.
1) Why your website’s carbon footprint matters
Each page view triggers server work, network transfers and rendering on the user’s device. At internet scale, small inefficiencies add up. The International Energy Agency reports data centres now account for around 1–1.5% of global electricity use and are growing quickly, with AI expected to push demand higher this decade. Cleaner, lighter websites directly reduce this load, and usually improve Core Web Vitals and SEO at the same time.
2) What contributes to a website’s footprint
- Hosting and data centres: compute, storage and cooling; carbon intensity depends on grid mix and efficiency (PUE).
- Data transfer (networks): distance, CDNs and cache behaviour determine energy per byte.
- User-side processing: heavy client-side JS, fonts and media increase device energy.
- Third-party scripts: large analytics/ads/tracking can raise data transfer by ~20%+ on average, with measurable carbon effects.
- Bots and crawlers: non-human traffic still consumes server and network resources.
Figure 1. Illustrative breakdown of contributors
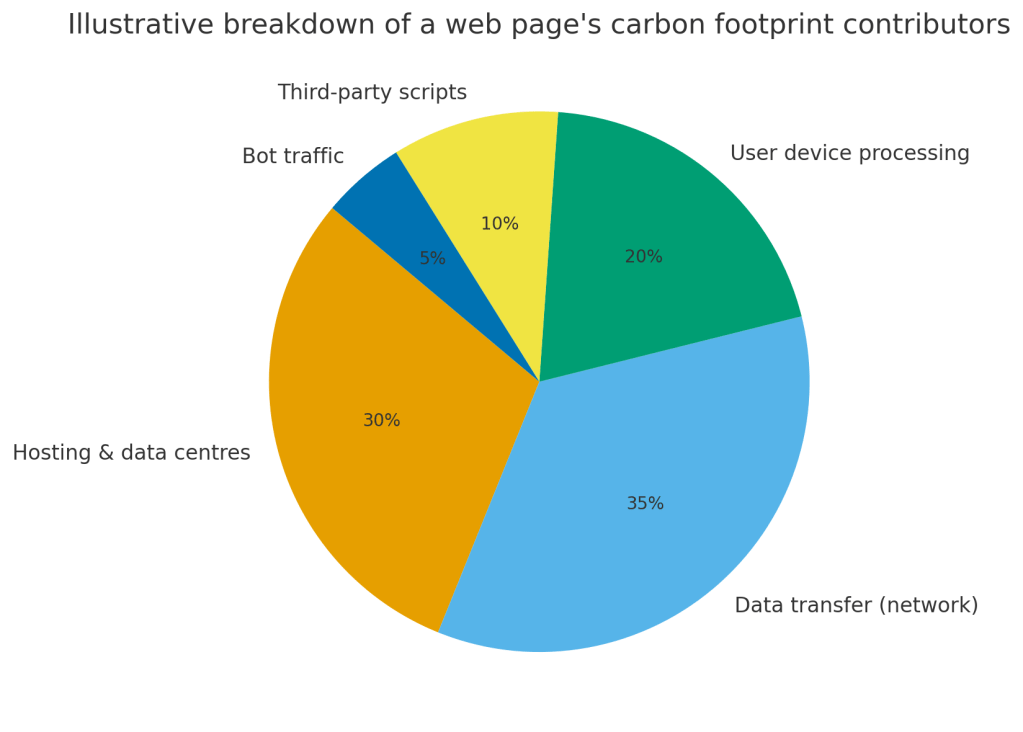
Note: shares vary by stack and geography; the chart is illustrative.
3) How to measure your website’s carbon footprint
Tools you can trust
- Website Carbon (Wholegrain Digital) — quick estimate of grams CO₂ per page view and annual emissions at your traffic levels. Website Carbon Calculator
- Digital Beacon — page-level scan with a breakdown by images, scripts, fonts and stylesheets; useful to prioritise fixes. digitalbeacon
These tools model energy per byte transferred, apply regional electricity carbon intensity, and report gCO₂/page-view and annual totals. The current global “average” page quoted by Website Carbon is ≈0.36 gCO₂ per view (use this as a rough benchmark, then beat it).
Turn numbers into action
- Test your homepage and top landing pages.
- Record gCO₂/page-view and page weight by asset class.
- Multiply by monthly page views to get kg CO₂/month.
- Re-run after each optimisation to verify deltas.
4) Ten high-impact ways to cut emissions (and speed up your site)
- Move to greener hosting: choose providers that run on renewables or have verifiable green power/REC procurement. Shortlist examples and check claims: OVHcloud’s “green hosting,” Kualo (Green-e recognised), and similar. Verify region and data-centre options for India.
- Optimise images: convert to AVIF/WebP, resize properly, compress aggressively, and lazy-load below-the-fold media.
- Tame video: avoid auto-play, show a poster image, defer loading until click.
- Minify and tree-shake code: remove unused CSS/JS and reduce bundle size.
- Use a CDN: serve static assets closer to users to cut latency and network energy. Backgrounder on how CDNs reduce distance.
- Load conditionally: use code-splitting and defer non-critical resources.
- Reduce third-party tags: keep only essential analytics; heavy trackers increase data transfer and emissions. Evidence shows ~21% extra data from tracking.
- Limit bot traffic: tune robots.txt, apply bot management/firewall rules.
- Fonts: prefer system or WOFF2 fonts, few weights, and font-display: swap.
- Quarterly page audits: remove orphan pages and legacy assets that no longer serve users; retest with Website Carbon or Digital Beacon.
5) Worked example: from baseline to improved
Assume 20,000 page views/month and a baseline of 0.5 gCO₂/view → 10 kg CO₂/month. After image compression (−30%), third-party cleanup (−15%), and greener hosting (−40%), residual emissions ≈ 1.5 kg CO₂/month.
Figure 2. Example reduction after optimisation
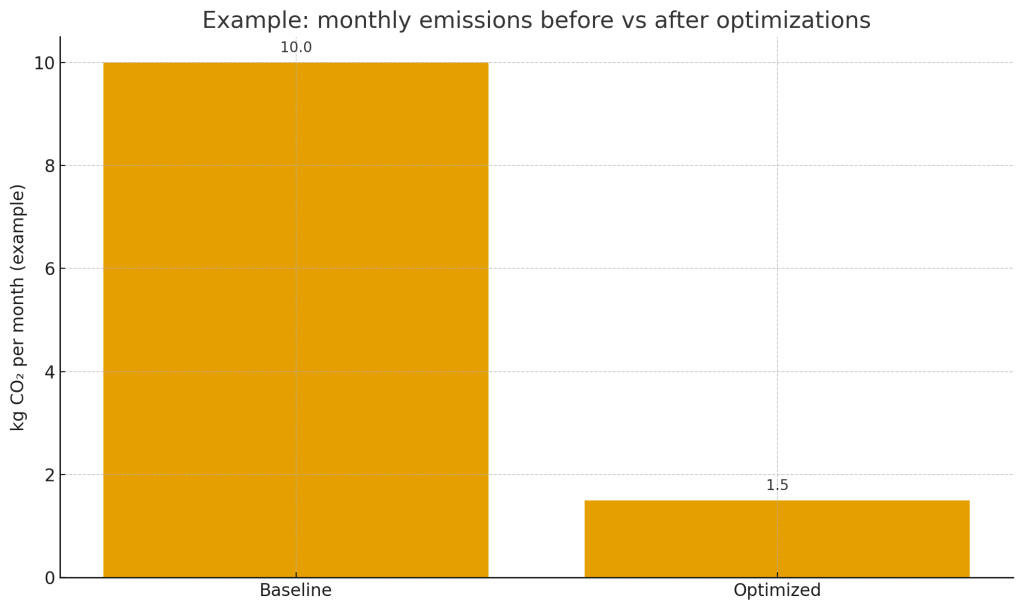
This example is conservative and for illustration. Your actual results depend on grid mix, caching and traffic profile.
7) SEO co-benefits of low-carbon design
- Smaller payloads → faster LCP/FID/CLS → better rankings potential.
- Fewer third-party tags → less JS contention, better stability.
- CDNs and caching → lower latency, improved user signals.
- Credible sustainability messaging backed by transparent numbers.
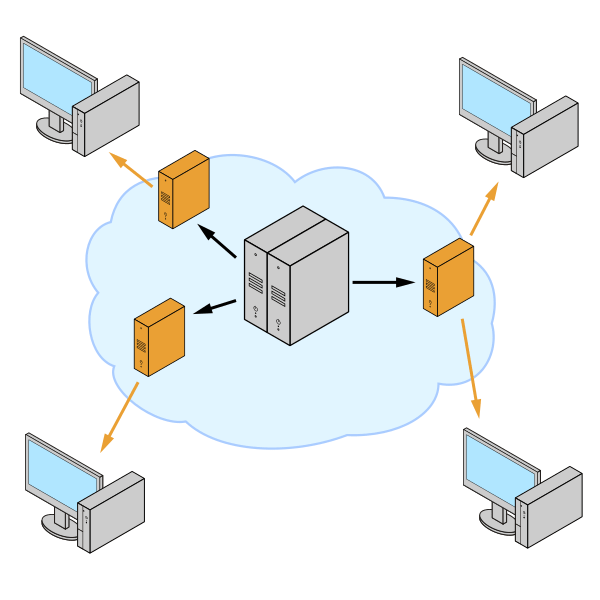
Figure 3 : CDN architecture diagram
8) Limitations and cautions
- Calculators are models; they estimate energy and CO₂ using average intensities. Treat results as directional, not exact. Website Carbon Calculator
- The science on total ICT energy use varies; estimates for data-centre electricity differ widely across studies. Use authoritative sources and be transparent about assumptions.
9) FAQs
Is “net-zero” web hosting possible?
Not perfectly. You can reduce operational emissions drastically and offset the rest, but full lifecycle impacts (hardware, cooling, networks, devices) are broader than hosting alone.
Which tool should I start with?
Run Website Carbon for a quick baseline, then Digital Beacon to see what to fix first.
Do CDNs always reduce emissions?
They usually reduce distance and bytes served from origin, improving both performance and energy use, but validate with your own logs and tests.
Are third-party scripts really that bad?
Empirical results based on large-scale telemetry show meaningful overhead from tracking, translating to additional emissions. Audit and keep only what you need.

